
Reports and analytics
Reports gather everything the components know about money, goods and customers. In the side menu these are two items: Reports — tables and charts by period, and Analytics — signals about what needs attention. The component is always on.
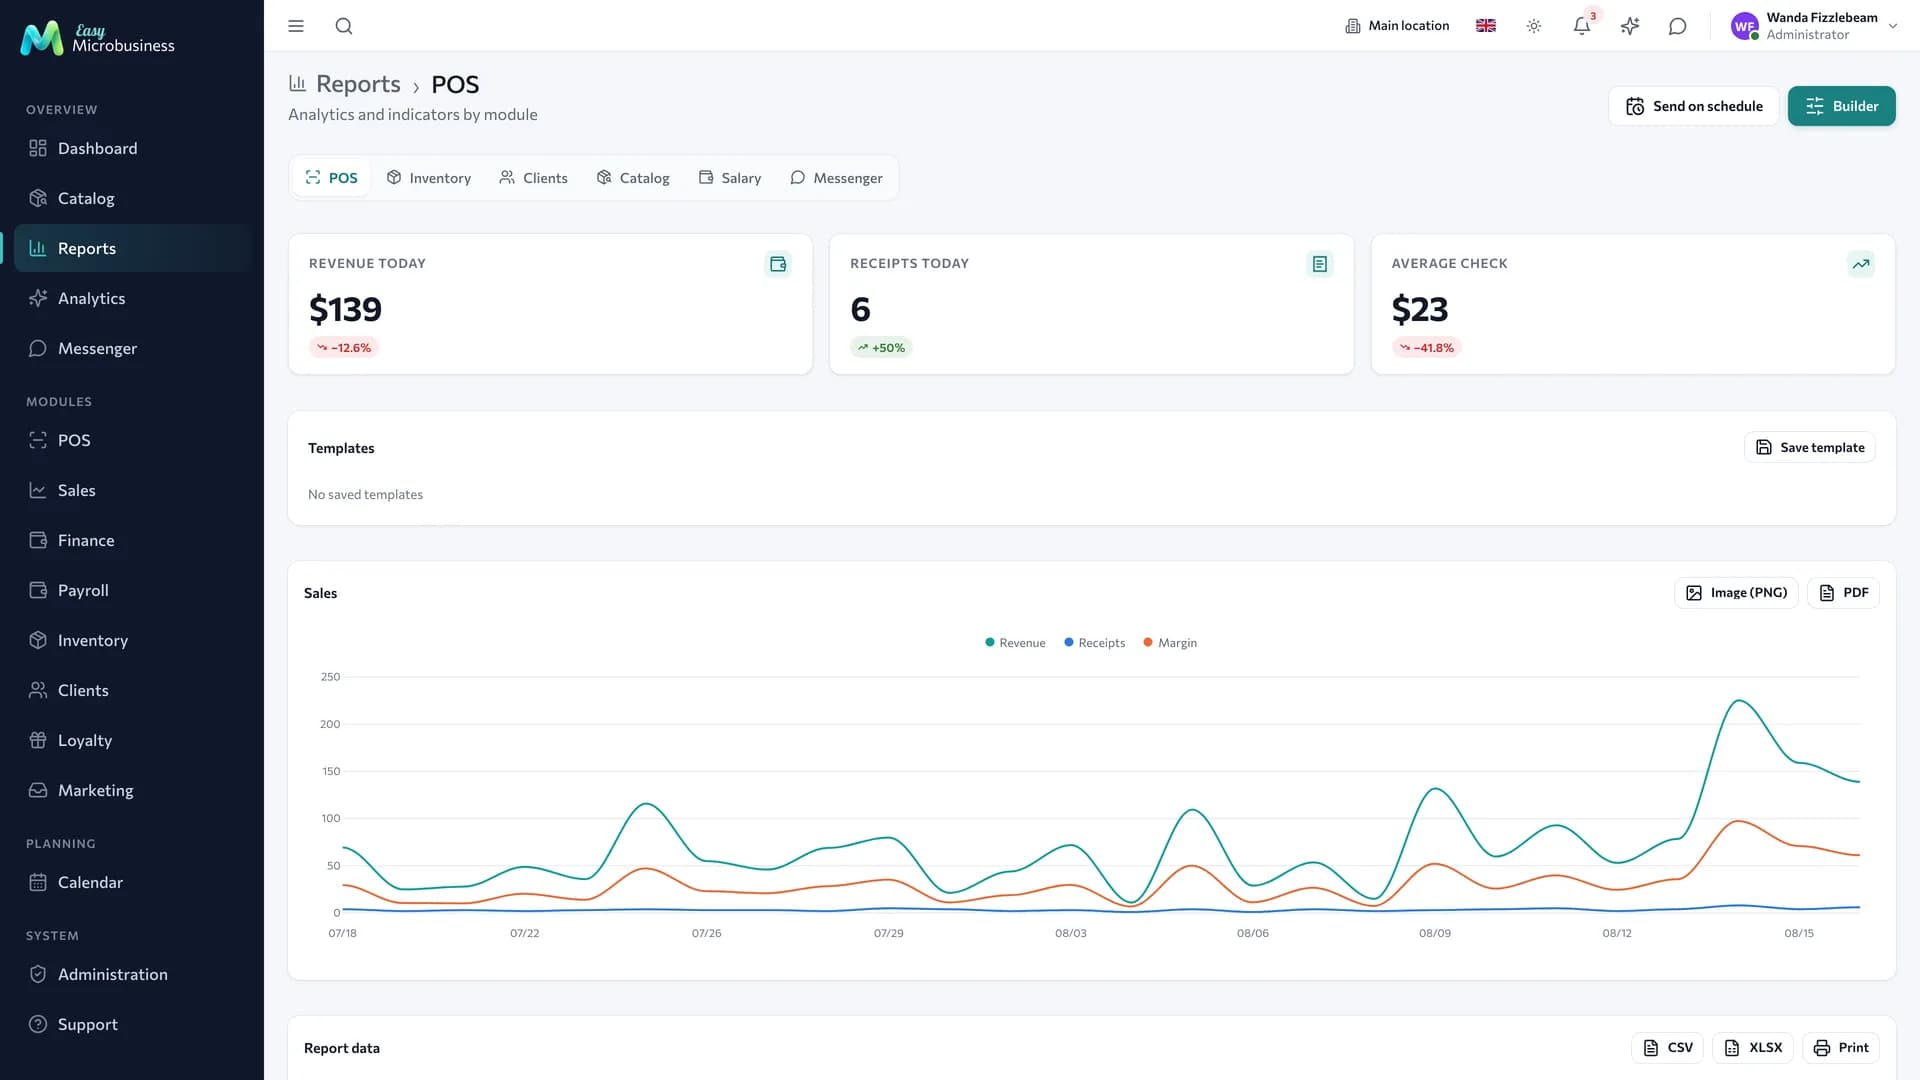
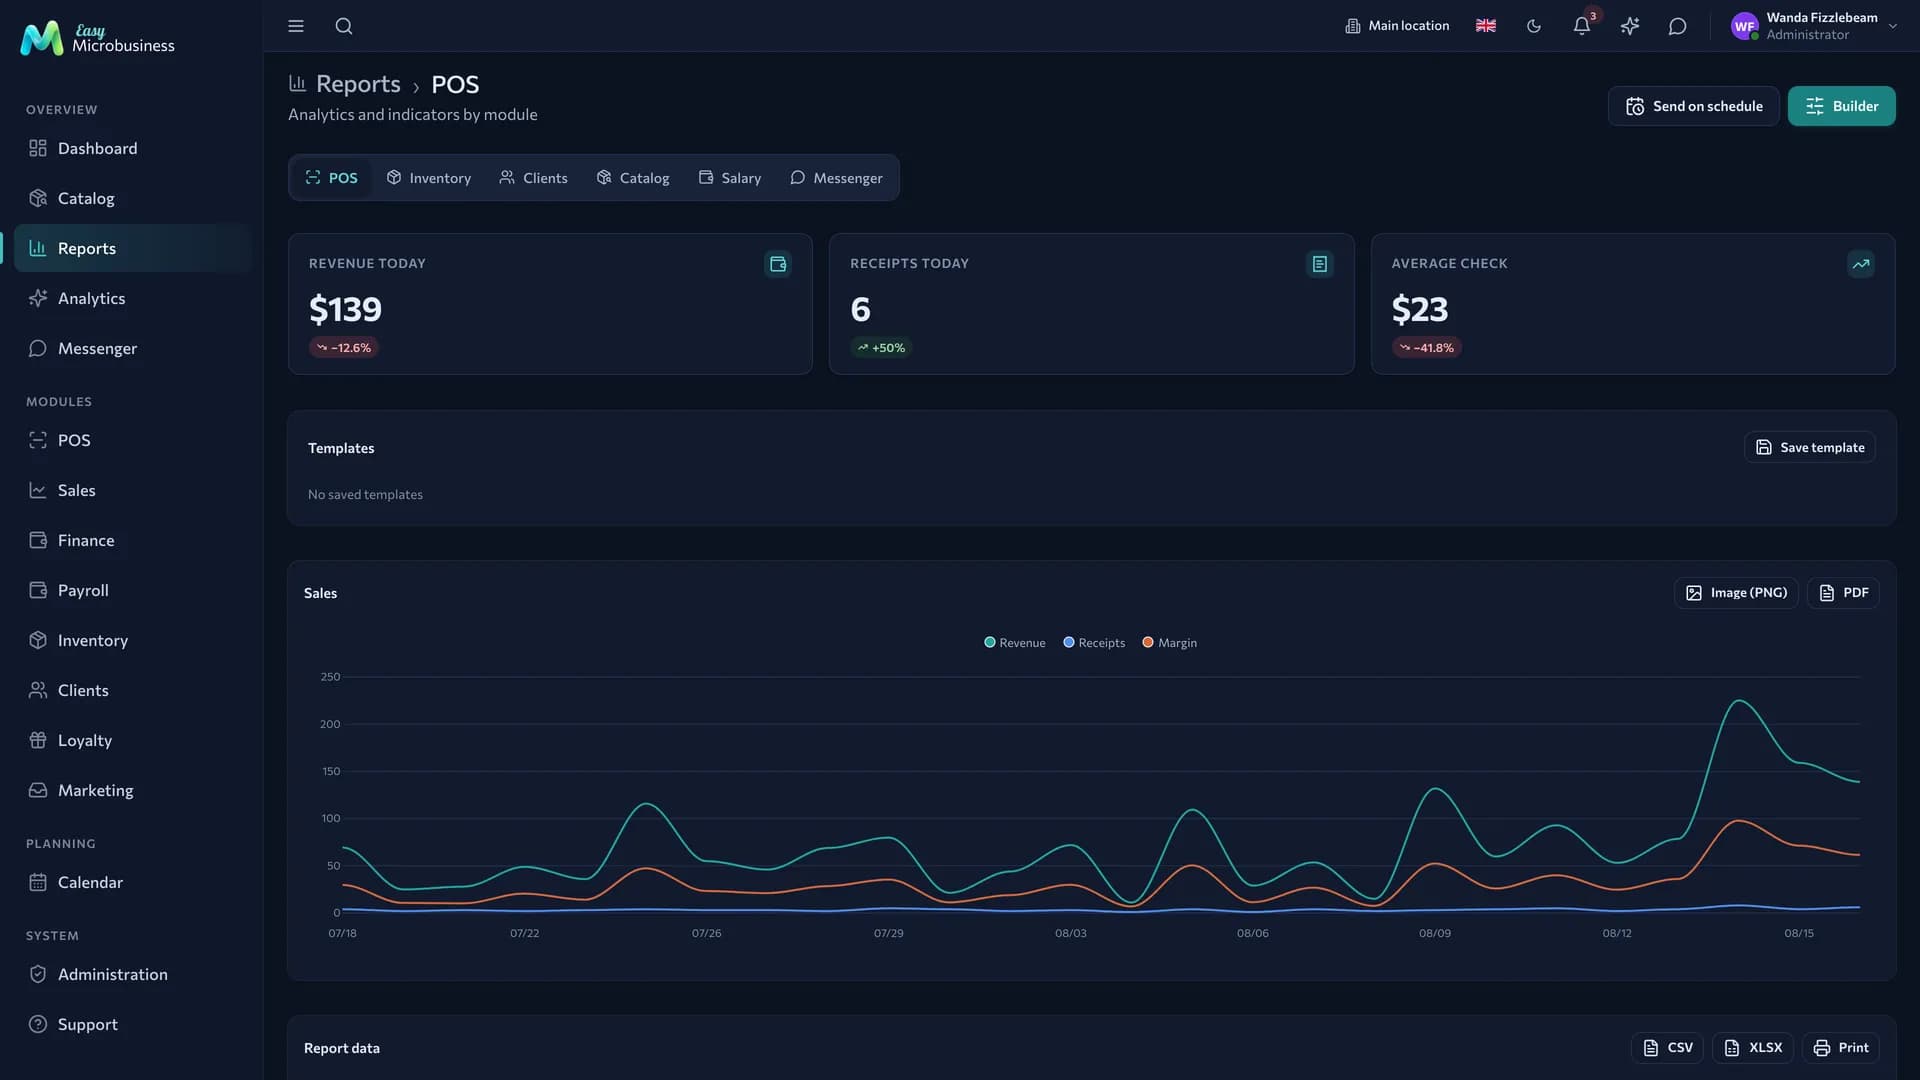
What reports exist
The set depends on connected modules: a switched-off component supplies no metrics.
| Report | What it is about |
|---|---|
| Sales | Revenue by day, category, employee |
| Cash shifts (Z-reports) | Shift totals: revenue, cash, discrepancies |
| Orders | How many orders and for how much, by customer and period |
| Shipments and volumes | What actually left and to whom: amount, units, number of shipments |
| Stock | What is in the warehouses and how much |
| Write-offs | How much is lost to damage and spoilage |
| Turnover | How fast goods leave the warehouse |
| Deal funnel | How many deals reached each stage |
| Profit by site | Income, cost and profit for every site |
| Resource load | How busy masters, rooms and equipment are |
| Attendance | Who comes to classes and who misses them |
| Packages | Sold and active bundles, remaining visits |
| ABC analysis | Which products feed you and which take up shelf space |
| RFM analysis | Customers by recency, frequency and amount |
| Crew output and load | How much each crew has done |
How to build a report
- Open Reports and pick the one you need.
- Set the period and the branch.
- Choose a breakdown in Group by: days, categories, employees, customers.
- Tick the metrics you want in the table.
A configured report is saved as a template: "revenue by branch for last month broken down by category" is set up once. A template can be personal or shared across the company, and one of them can be made the default.
Finance and profit
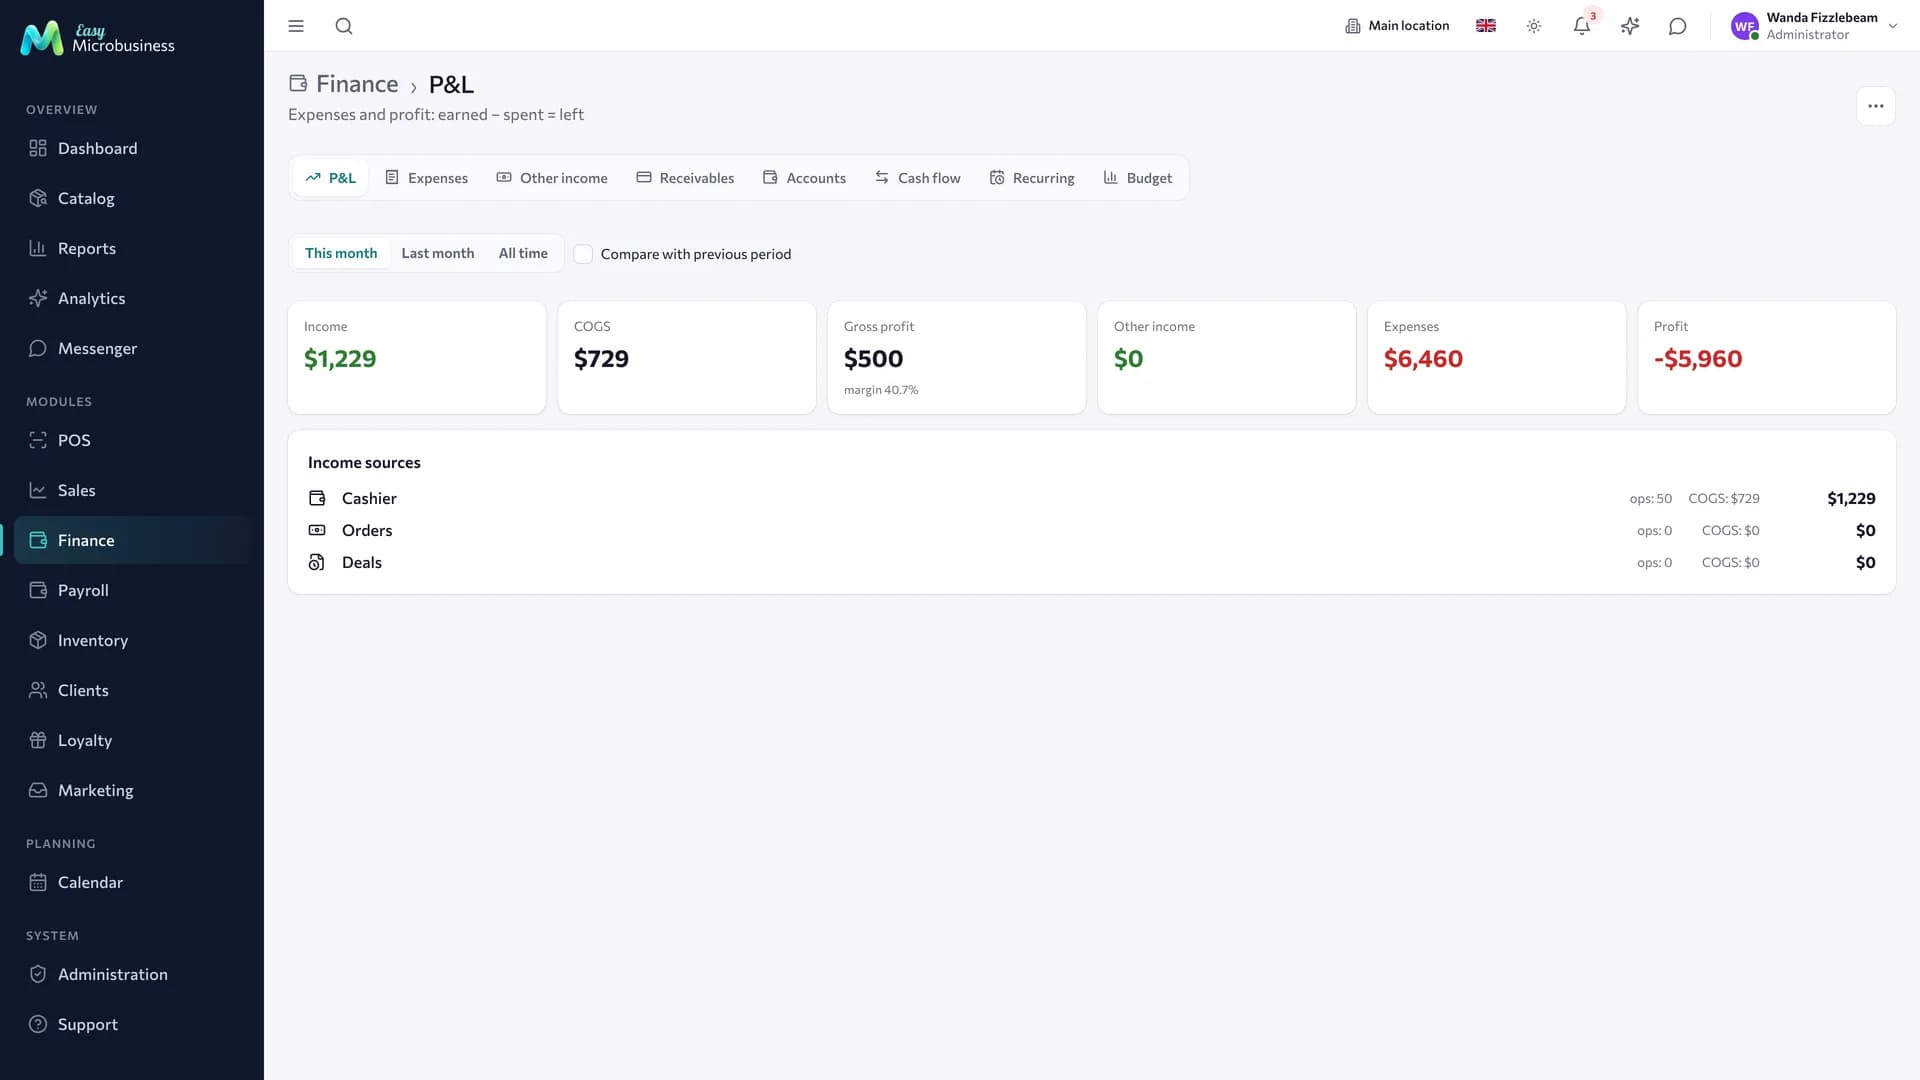
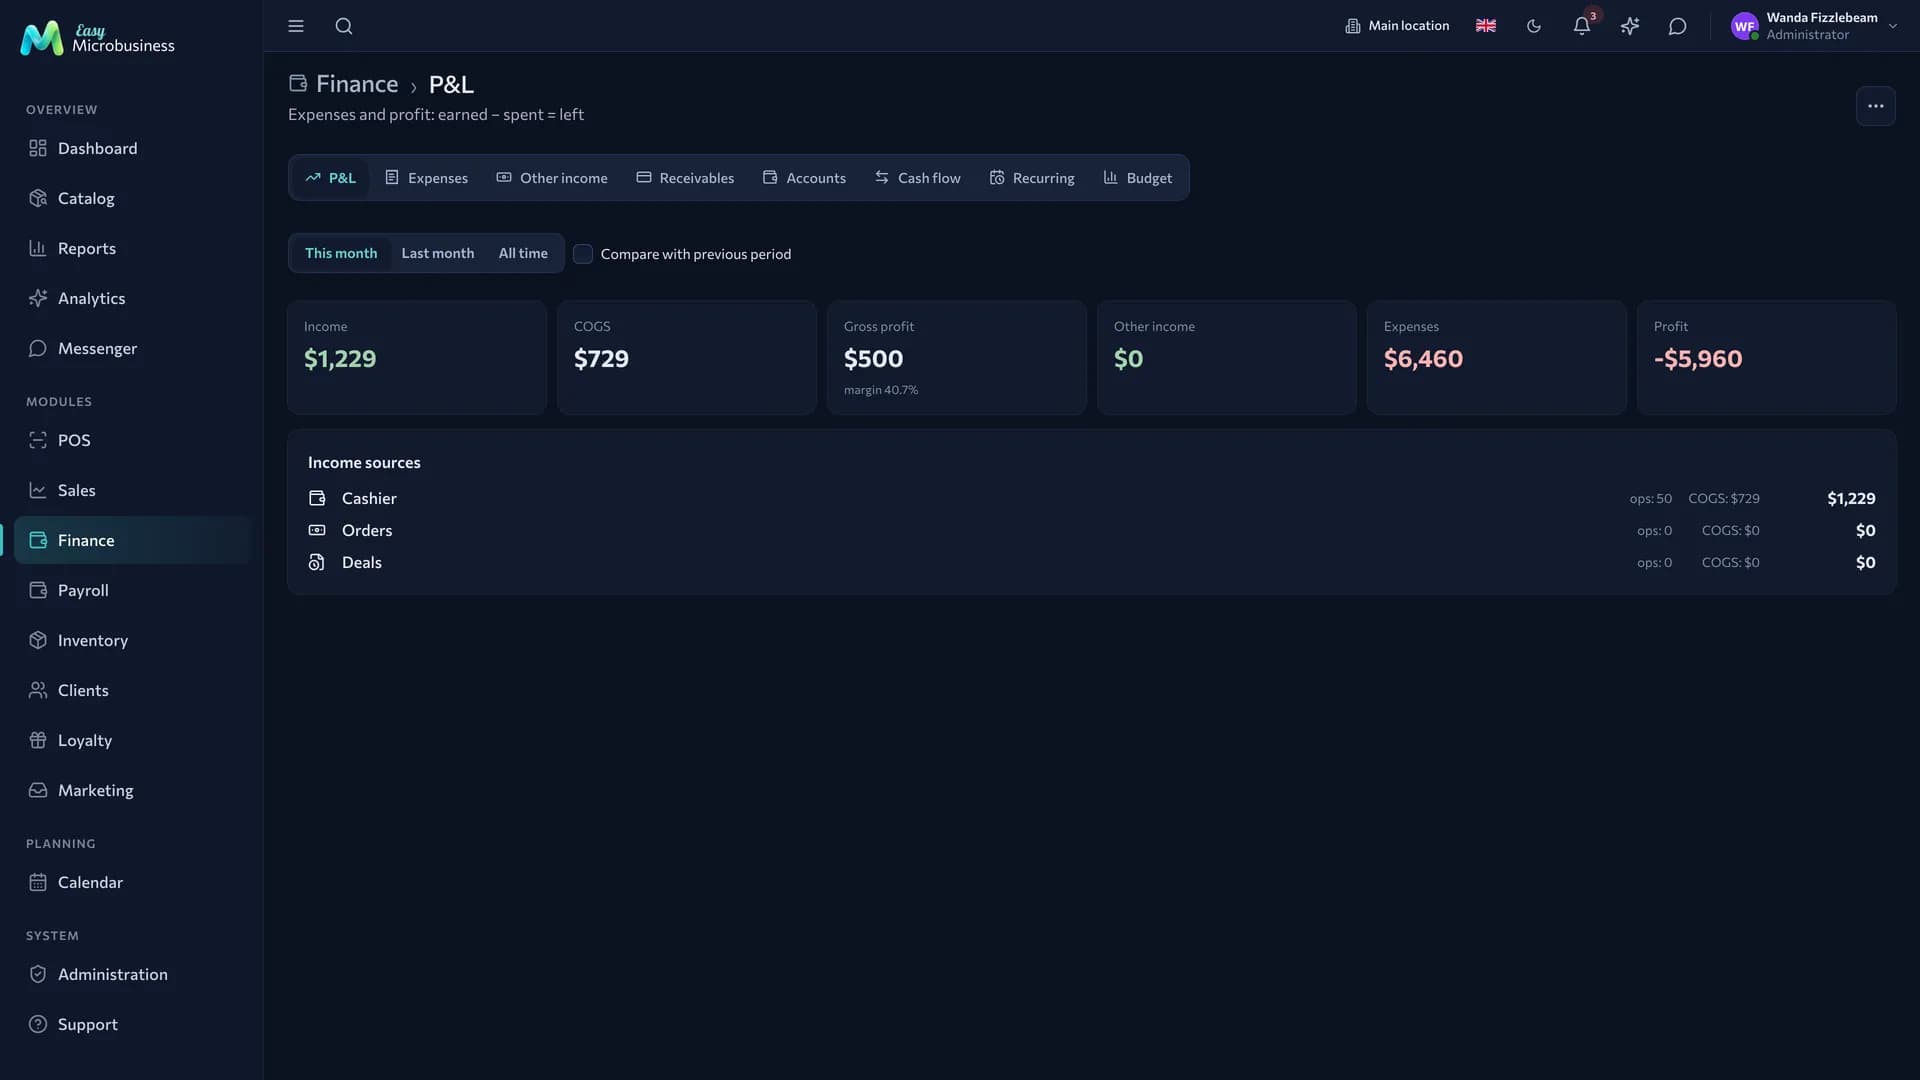
- Profit and loss — revenue, cost of goods, expenses and profit for a period. An order enters the report when it is completed, and the cost is taken for what was actually shipped.
- Cash movement — what came in and what went out, by till and account.
- Expenses — rent, payroll, purchases. Entered by hand or arriving from payroll and inventory.
- Receivables — who owes and how many days overdue. The term comes from the customer card. Debt on an order with shipments is the goods handed over minus what has been paid.
Analytics signals
The Analytics section checks situations that need attention and shows them as a list.
| Signal | What it is about |
|---|---|
| Low stock | Stock below the reorder threshold |
| Low margin | The price has come close to the cost |
| Revenue drop | A dip compared with the previous period |
| Branch revenue drop | One location has fallen out of the general picture |
| Stalled deals | No movement for a long time and not closed |
| Overdue receivables | The due date has passed and the debt remains |
| Sleeping customers | They were active and stopped coming |
| Service due | Scheduled maintenance is near or overdue |
| Communication channels are down | Sending to customers is on but no connector is set up |
A signal has a severity level. A repeat firing does not spam: the state is remembered.
Schedules and export
A report can be put on a regular email schedule — for example a revenue summary every Monday morning. Active schedules are listed separately.
Tables export to CSV and XLSX, charts to PNG and PDF.
Who sees what
Reports follow roles and branches: an employee sees their location, a director the whole network. Access to reports with sensitive data is recorded in the audit log.
In short
- Reports give tables and charts by period, Analytics gives signals about problems.
- The set of reports depends on the connected components.
- A configured report is saved as a template and can be emailed on a schedule.
- An order enters profit when it is completed, and the cost is counted for what was shipped.
Related components
Reports read the POS, inventory, orders, customers, deals, scheduling and messenger and change nothing in them.